
Strain Gauge 2.0
- Cody Ratterman

- Oct 11, 2021
- 4 min read
An earlier version of this project was also posted separately. Because of the ongoing nature of the project, this is an update with my progress. View it here.
Why Would I Use This?
When training for climbing, finger strength is one of the most important but also difficult things to specifically train. A common tool is called a hang board, with various edges to hang from. There are very many different protocols and methods people use, but a new one is with maximal recruitment pulling as hard as you can but holding yourself down, attempting to lift yourself up but never actually going anywhere. A popular example program is here.
This method has multiple advantages over a traditional setup adding weight to your waist until you can barely hold on such as: no awkward weights to stand up and maneuver with, naturally controlled and varied intensity from pulling as hard as you can, and a much more mobile setup perfect for working out at home, at the office or between travel instead of at the gym. The major downside is no quantitative measurement for how strong and consistent you are. Some days you 'feel' stronger and lighter and can pull harder, but you cannot know for sure. This is very important to know for advanced climbers near pushing toward their potential often train for weeks to improve their hangs by 2-3% or add a couple extra seconds.

Exercise science researchers are using methods like this, but with force sensors to measure how hard the participant can push or pull. This also allows researchers to study how the force begins to drop off as the participant fatigues. After learning about these new research methods and hearing about some people applying them to finger and pulling strength with climbers, I wanted to get one. There were two main problems: First, most of the devices used by researchers and coaches cost hundreds or thousands of dollars. Second, the cheaper devices couldn't do things I wanted such as run interval timers, work with a mobile device or easily export results and expensive devices were too complex and inconvenient for weekly workouts or group settings. The only way around that was to develop my own.


What Can it Do?
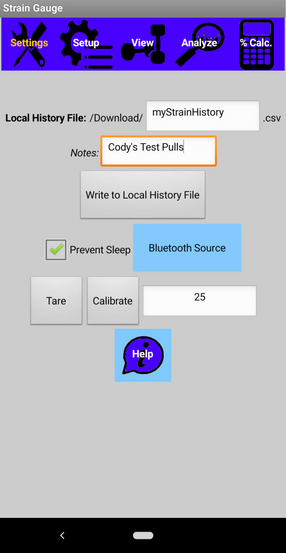
After a lot of experience with training, I added all the options/features I wanted to perform and record my workouts. The strain gauge hangs from a solid anchor with a portable hang board attached to the bottom. You can use one arm or sit and weight yourself down to anchor yourself down. There is a countdown mode with customizable protocols for how many and how long you want your reps, rests and sets to last. Use Pull Intervals allow the user to separate their pulls from the timer so it records as "working" or "resting" whenever the reading is above or below the given threshold. Warning beeps can be played in time with the countdown or at custom times. The main viewing screen has the main workout controls and shows live updates on the time, reading and interval information. The analyze screen updates with each new interval and can display a variety of statistics in a list or graph format. This allows the user to see how they're doing between sets. The interval summaries and raw data can be written to a file in the downloads directory then saved or shared from there.
How it Works
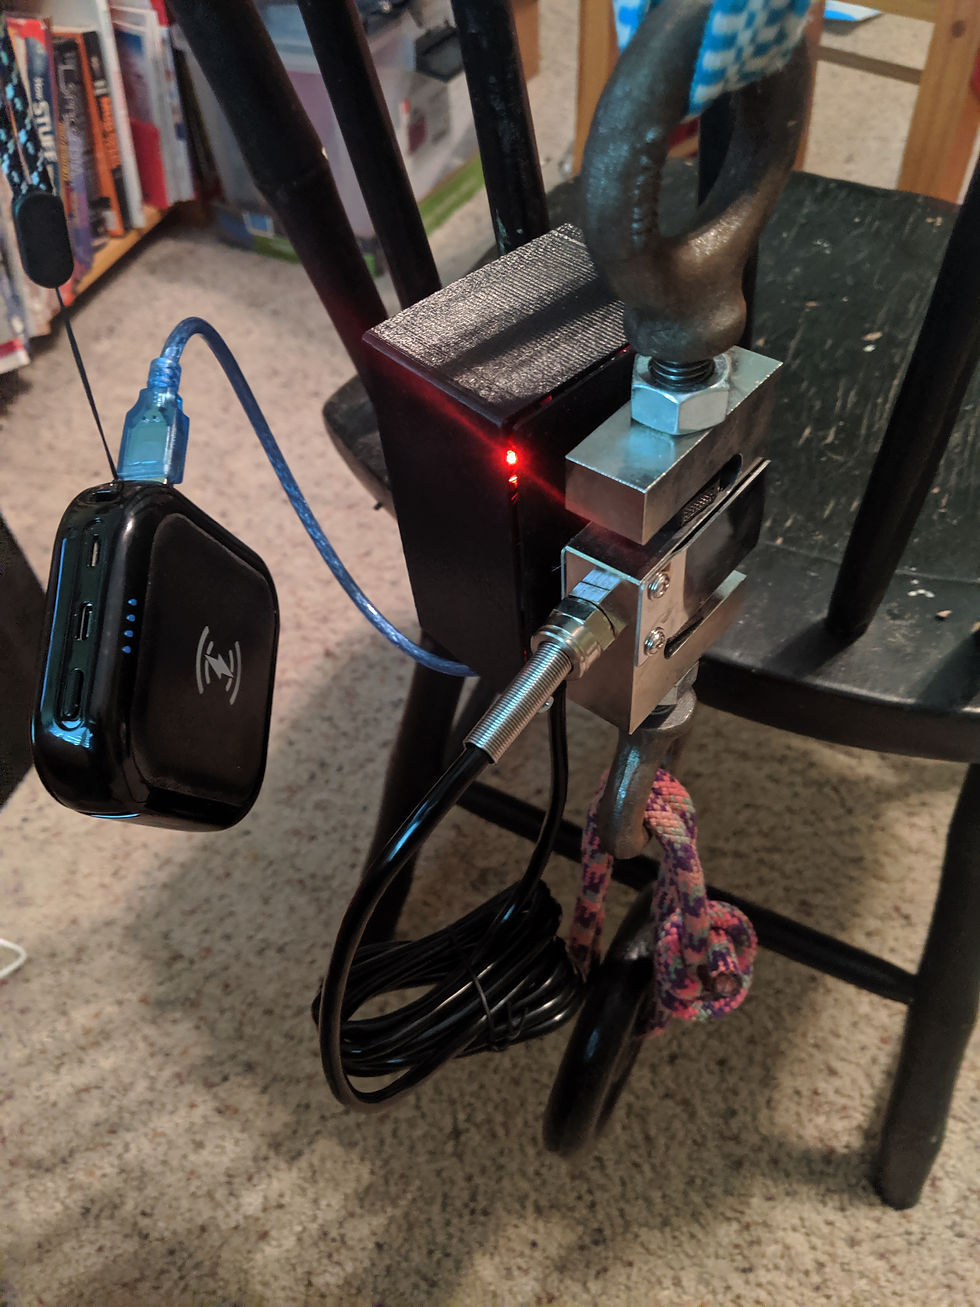
The strain gauge is built around an S-shaped load sensor rated for measurements up to 200kg (440lbs). Typical forces would be about %50 - %180 body weight (depending on 1 or 2 hands and ability level) and most users would weigh 100-180 lbs. Larger sensors are made, but the lower the range the more accurate it will be. The readings are very consistent and usually only vary by +- 0.1 lbs. An eye bolt is screwed and locked onto each end with a nut. The sensor connects to a black wire with two functions: a HX711 amplifier and an Arduino nano. The nano is where all the data is processed into reading. The nano also does interval calculations such as calculating current duration, peak, impulse, average. The nano does not have much storage, so it sends this information with a protocol over blue tooth to the phone app. The phone app does not run a timer, record settings, or receive anything directly from the sensor (this is all done on the nano). The phone app has three purposes: remote/user interface, past and live data visualization and recording previous settings and data. The phone app was created using MIT App Inventor with a drag and drop coding interface. This is easy to convert and test from computer software to android apps. The complexity of the drag and drop coding for large projects is extra motivation to put as much computation as possible on the Arduino side. The nano is powered with a usb chord connected to a portable charger or computer. The arduino code is published here.


Comments